Marketing Cloud Intelligence (Datorama)
Marketing cloud Intelligence is a platform to store and visualize marketing data which are coming from various sources.
It is easy to use and understand there is no need for much technical requirement. Originally, Marketing cloud Intelligence was used in the ad technology field to help companies easily create reports and dashboards.
Marketing cloud Intelligence is AI-powered marketing intelligence. Make smart decisions by connecting and acting on all your marketing data, investment, and KPIs (Key performance indicators). Marketing cloud Intelligence allows marketers to never lack the data they need to measure marketing performance and their campaign effectively.
Marketing cloud Intelligence is a data platform where it is largely used to upload data and visualize marketing data through reports and dashboards.
Why we use Marketing Cloud Intelligence?
- Marketing Cloud Intelligence Allows all marketers to unify their data, KPIs, and stakeholders across teams, channels, platforms, etc.
- In Marketing Cloud Intelligence its Compare and variation the performance of all your channels and campaigns in one view.
- Marketing Cloud Intelligence allows you to connect and unify all your data and insights into one centralized platform for measuring, optimization and reporting.
- Marketing Cloud Intelligence can analyze and report across all the channels and campaigns so that every stakeholder in the organization get the right information at their fingertips.
- Act and collaborate drive ROI to bring the organization toward together to achieve common goals using built-in activation and collaboration tools and connect to every customer to make decision-makers and marketing technology stack.
- Marketing Cloud Intelligence allows you to unify all your data, KPIs, and stakeholder team, channels, platforms etc.
Editions and Features of Marketing Cloud Intelligence
Marketing Cloud Intelligence Editions are categorized into three parts:
- Starter
- Growth
- Plus
Every edition pricing is based on which module you want to purchase, and which edition can be configured and offered with what you need.
Edition’s features are categorized as per requirement of edition
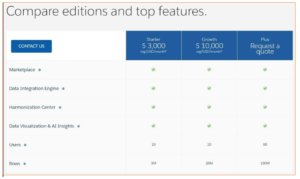
Pricing Packages for every Customer and solution
Starter, Growth and Plus package options meet customers’ unique budgets and needs and that pricing must be changed as per requirement.

Data ingestion in Salesforce Marketing Cloud Intelligence

- Once all the configuration is done in the marketing cloud and completes all the activities in the marketing cloud, Marketing cloud Intelligence takes place to unify the data and visualize the data in reports and dashboards with help of different data sources.
- Here we get all the data from various sources and put it into different data streams as per the source file.
- We could upload the data in the Marketing cloud Intelligence platform in two ways:
- Offline.
- Online/Through API configuration.
- Once the data ingest insight in harmonization then you could segregate the data in different segments and metrics to create a pivot table and reports which helps stakeholders and their teams, they get the right information and make decisions smarter.
- In the marketing cloud Intelligence platform after harmonizing the data you could visualize and analyze it in the dashboard which helps to grow ROI.
- There is more feature in the marketing Cloud Intelligence, once report or dashboard has been done you could schedule all the reports and dashboard to the emails or you could directly export into your system.

How Does Data Get into Salesforce Marketing Cloud Intelligence ?
No matter which data upload method you plan to use, we start in the same place: the datorama (data) stream list.
The main methods for uploading data in Marketing cloud Intelligence are:
- APIConnect
- TotalConnect
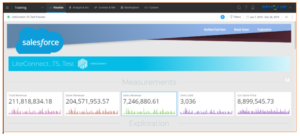
- LiteConnect
API Connect
This allows you to connect to external platforms using their API’s. With API connector, the source fields are automatically mapped with corresponding Marketing cloud Intelligence fields, based on the data model.
Marketing cloud Intelligence has a library of API Connectors with the most widely used platform in digital marketing.
This connector library regularly updates new connectors and existing connectors are updated with any changes from the source Platform.

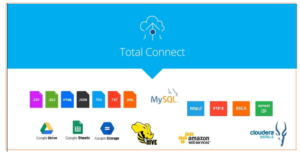
Total Connect
This method allows you to upload any flat file into the system through the Marketing cloud Intelligence data model, and thereby customize data integration.
TotalConnect is typically used when you need to upload data from a source for which no API connect exists.
It is enabling the automation of data ingestion in both push and pull mode variety of delivery method from:
- External databases to file sharing platforms
- When we are using this option to upload files there is no API Connector available.
LiteConnect
LiteConnect allows for hustle-free uploading of files into Marketing cloud Intelligence without using the predefined structure of the datorama data model or performing any data mapping.

In a matter of just few clicks, a file can upload in its original format.
Marketing cloud Intelligence also automatically generates dashboards so you can instantly see your LiteConnect data visualized, reducing time consumption from initial upload to almost nothing.
For example: if we need to display weather data quickly and easily alongside your marketing data: LiteConnect is probably the option you should consider for the task.

Data Harmonization
We use data harmonization to bring together data from multiple sources to function as if they were a single data source.
Although there are various ways to harmonize data, there’s one characteristic that can tell you whether data has been harmonized successfully.
When visualizing multiple source data, if it’s perfectly aligned from all sources at the level of a shared value, it’s considered harmonized at that level. Let’s take three different data sources.
Each source has its own unique data, and all sources have activity related to the same marketing campaign.
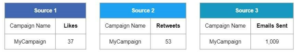
If this data is visualized in Marketing cloud Intelligence —using a simple table widget for example—the data is considered to be harmonized if the sources are perfectly aligned along the same row for the same campaign. Here’s how it will looks.

Analyze and Act
In this section, you can create pivot tables, goals, and thresholds, and automate the reports.
You can automate the reports and distributes them through various channels (All now embedded with salesforce’s AI).
Analyze and Act section comes with three main features in Marketing cloud Intelligence:
- Pivot Table.
- Reports.
Pivot Table
In Pivot table you can explore and dissect data from multiple perspectives. You could Filter, Sort, and group large volumes of data according to your selected dimensions (fields) and measurements (metrics).
You can create custom reports using Pivot tables and organize, summarize and slice data without needing to write or run queries, like SQLs.
With a pivot table, you can be able to calculate, summarize, and analyze data to see insights into your data through comparisons, views, patterns and trends. There are five out-of-the-box pivot table you could use:
- Email daily send summary.
- Best performing Send day.
- Audience Engagement over time.
- Campaign performance.
- Journey performance.
Note: The Pivot tables can even be saved for future use and exported to .csv as well.
Reports
Reports are how you retrieve view, and share a detailed analysis of your data. A flat table report extracts your raw data into a csv or excel file with different tabs.
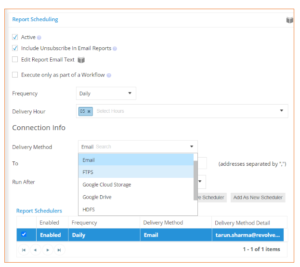
You could create a report from scratch, export a pivot table or dashboard when needed, or also schedule report at specific time of day.
In a report, it has one more feature, once reports are scheduled these reports are shareable via Azure Blob, Email, FTP, FTPS, Google Drive, HDFS, SFTP, AWS-S3, and Google Cloud Storage.
Using different options, you could immediately create or schedule several reports as needed like. Excel, CSV, TSV, TXT, PNG, PDF, PPT, Pivot table (Excel), Flat table (Excel).

Visualize
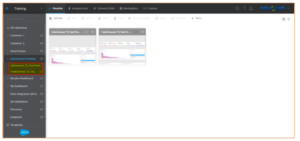
In visualize tab, you can display your data using the sleek Dashboards. Each dashboard is similar to a folder and contains a set of pages.
These pages consist of various charts and table, which are called widgets.
Marketing cloud Intelligence brings all your marketing data in visualization and provides an additional tool, a canvas that allows you to build an effective dashboard.
Collections (Dashboard): The collection has several pages. Collections grab all your data and consume it in one place, it is used to visualize, organize and personalize data together in a collection.
Pages: page segmented the collection. So, you could divide the data according to the preference such as product, campaign and social media.
Widgets: Widgets are various graphic elements that appear on the page such as bar graph etc.
You can create fully customize dashboards in canvas, the drag and drop functionality and a wide range of reusable visualization.
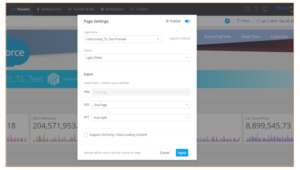
There is a feature in visualization you could setting up theme in light and dark mode and export the dashboards in .PNG, .PDF, .PPT file in your system.
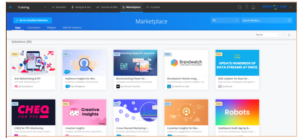
Marketplace and Apps
Customers and partners could use the Marketing cloud Intelligence marketplace to extend the out-of-the-box functionality of their workplace with additional, custom apps built on their platform. The marketplace offers easily downloadable apps that you could customize the app to your own needs.
The Marketing cloud Intelligence marketplace gives customers the ability to expand into new data sources, areas of measurement and reporting insight.