

Overview
Einstein Messaging Insights is a tool that monitors your marketing performance and alerts you to changes, no matter where you are in the Marketing Cloud.
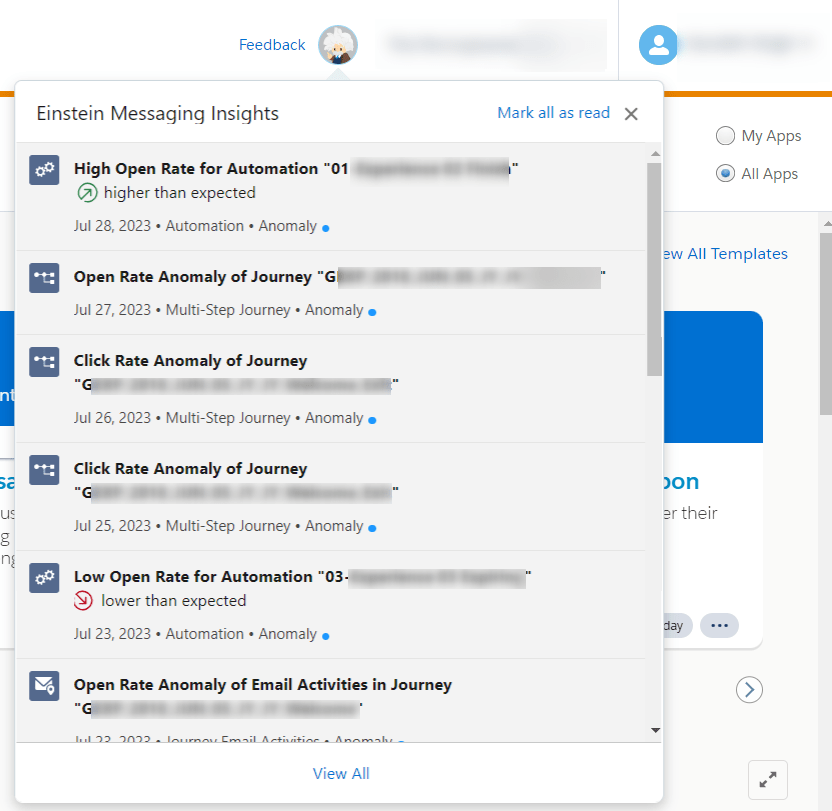
The Einstein notifications badge appears in the header, providing constant access to information about how your email sends and journeys are performing. If an anomaly occurs, the badge will alert you.

You can then navigate to the insights hub for more information about quantifying your results.
Set Up Einstein Messaging Insights(EMI) in the Marketing Cloud
Initially, it is disabled in the marketing cloud, to use this feature need to activate in the particular business unit.
Insights that relate to sends or journeys within a business unit are visible to all users in the business unit. To allow analysis, an automation is created that moves data to the Marketing Cloud’s Einstein Platform.
Here are the steps on how to activate this EMI feature in the marketing cloud:
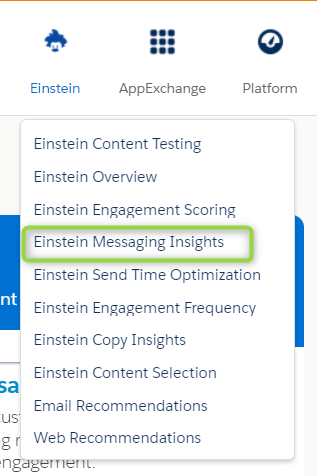
- Navigate to Marketing Cloud Setup.
- Go to Einstein tab under Platform Tools.
- Click on Einstein Messaging Insights.
- Activate Einstein Messaging Insights for your business unit.

Einstein Messaging Insights(EMI) Dashboard
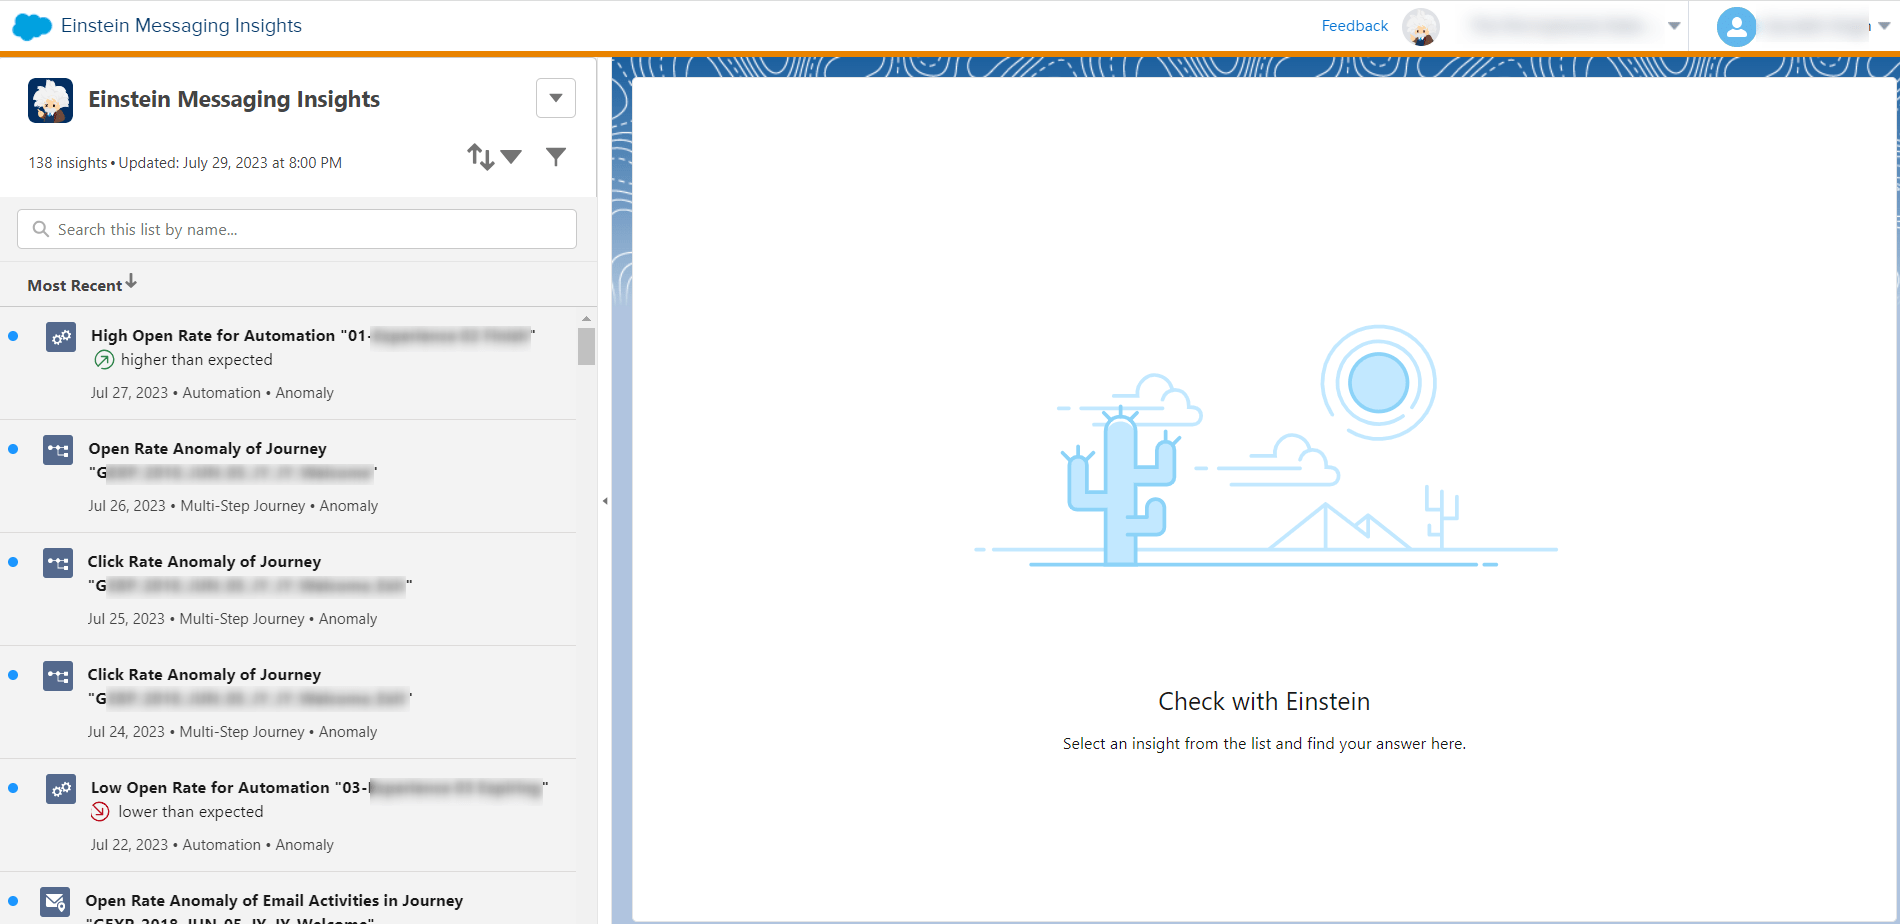
The Einstein Messaging Insights dashboard provides a centralized location for viewing all of your insights.
You can view messaging Insights Dashboard by following this path :
Login to the Marketing Cloud -> Go to the Einstein tab ->Click on the Einstein messaging Insights
You can click on an insight to learn more about it, including the factors that influenced its performance.
Einstein messaging Insights can be used to view and analyze the following:
- Anomalous results: These are results that are significantly different from the expected results. For example, if the open rate for a batch send is significantly lower than the open rate for similar sends in the past, that would be considered an anomalous result.
- Send-related information: This information includes the job ID, date sent, total delivered, and other details about the send.
- Variable: This is the metric that was identified as an anomaly. For example, the open rate, click rate, or unsubscribe rate could be a variable.
- Contributing factors: These are the factors that may have contributed to the anomalous result. For example, the subject line, email content, or send time could be contributing factors.
- Sentence and table format: This dashboard provides a graphical and tabular view of the results of your email sends. It can be used to identify anomalous results and to understand the factors that contributed to those results.
- Einstein evaluates each journey and each send once each day to produce insights.
- Emails track events, such as opens and clicks, for many days after sending. Einstein uses the events collected for up to 7 days after an email send to reassess whether the send is an anomaly or not.
- The variables that Einstein Messaging Insights measures for Journey Insights and Batch Send Insights are open rate, click rate, and unsubscribe rate.

In the above image, selected journey anomaly insight has Actual Open Rate of 32.26% which is lower than expected, Upper Bound is 68.10% and Lower Bound is 52%. Also, has some email activities with their delivered change and open rate change of the particular email sent through the Journey. Apart from that 2 email activities Email 2 and Email 4 had more impact than other activities.


